Finding the access path for Columnar queries #2

Usage Lists
In my last blog Finding the access path for Columnar queries I was reiterating the case for columnar data storage but bemoaning the lack of any means to see in the access path how the data is being retrieved. It merely shows as a table scan (TBSCAN) and you need to trust that what is going on under the covers is the optimum set of operations.
But what if you’re not the trusting sort, or there’s been a change and the customer’s queries are not running quite so well? How do you dig into the access path and find out what Db2 is up to?
Well, usage lists are one option. These have been around for a while now and provide a means of recording every DML statement that references a table or index. Once it’s switched on, it will provide a huge range of data: rows read, inserted, deleted, etc.; logical and physical reads, etc. Exactly the sort of metrics that might tell us what the optimizer is really doing when it says it’s doing a TBSCAN on the columnar table.
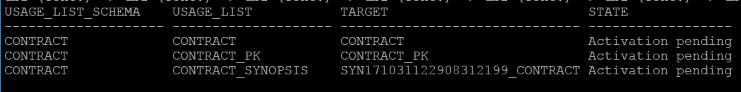
So, let’s look at an example. First of all, we need to locate all the objects associated with our columnar table. I’ve run a query to show the objects associated with a table I’m particularly interested in, named CONTRACT (I’m not including the SQL here as it would take up much of the blog, but drop me an email if you’re interested and I’ll share it with you). Here’s the output: (click image to enlarge)

Hopefully you can see that we actually need to monitor the usage of 5 objects; the CONTRACT table itself and its associated synopsis table (SYN171031122908312199_CONTRACT); the automatically created CPMA indexes (see my previous blog for an explanation of Synopsis tables and CPMA indexes): one for the base table and one for the synopsis table. There is also a row showing the manually created Primary Key for CONTRACT; CONTRACT_PK.
The syntax is fairly straightforward and allows us to create the first 3 Usage Lists very easily:
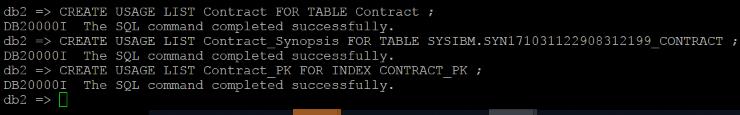
Gotcha #1
But when you try and create a usage list for one of the CPMA indexes…
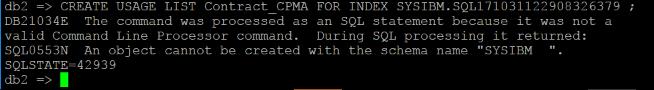
That’s actually a bit misleading; the error message suggests that I’m trying to create a usage list within a schema that starts with SYS. I’m not and, if I interrogate the usage list details using the MON_GET_USAGE_LIST_STATUS table function, I can see that a usage list has been successfully created on the synopsis table. The usage list is in schema CONTRACT even though the target object is in SYSIBM:
Gotcha #2
if you try and get results back from this table function without issuing a
SET USAGE LIST usage list name STATE = ACTIVE
command, you will probably not get any results back.
The problem with creating the usage list for the CPMA indexes is that they are not supported. Chapter and verse (from the IBM Knowledge Centre ) states
- You can create a usage list only for the following types of indexes:
- Block indexes
- Clustering indexes
- Dimension block indexes
- Regular indexes
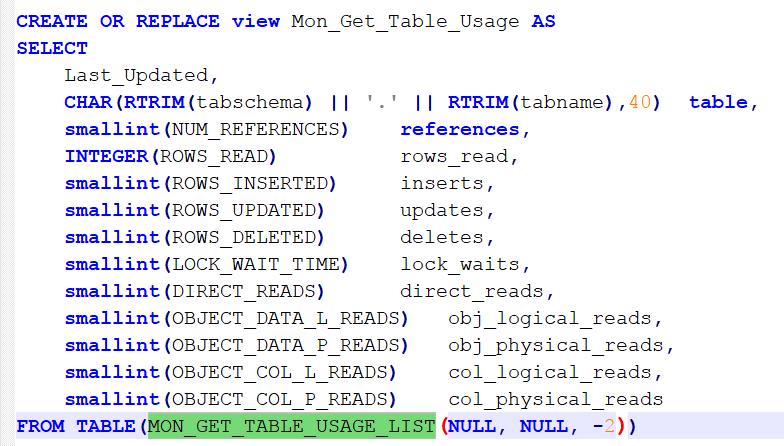
No CPMA indexes. Well, let’s see what we can get from the usage lists we have created. The method for interrogating the collected stats in the usage lists is to use the table functions MON_GET_TABLE_USAGE_LIST and MON_GET_INDEX_USAGE_LIST. These will return a lot of data (76 columns from the former, 30 from the latter) so I tend to just home in on a sub-set. I’ll build a view based on a select from these table functions and store the before and after metrics for a query I want to examine.
Here’s an example of the view I’m using in this exercise for the table usage
If I execute that now it’ll not return any data, as I’ve not run any queries in this environment yet. I’m then going to execute a query which uses the CONTRACT table and which I want to know a bit more about. I’ll spare you the details of the query but, having executed it, I can examine my view for table usage and get the results below:

This seems to indicate that the table was scanned; the ROWS_READ figure for the CONTRACT table is equal to the total row count. That might be an anomaly of the columnar data. More importantly, perhaps, you can see a logical read figure of 1,921 and a physical read figure of 50. That seems pretty efficient; very little data had to be taken off disk and the number of pages of data being read from the buffer pool and from disk is relatively low.
The same is true of the synopsis table; the ROWS_READ figure equals the total row count, but there were only 19 pages of data needed to accomplish the data skipping for this query, and they were all in memory.
If I try and interrogate the index usage view though, all I can see is this

There are no usage lists for the CPMA indexes so all I can see here is that the manually created Primary Key was not used in this query, which is no surprise as it really only exists to enforce uniqueness.
NB: If you want to confirm that the details you’re looking at relate to the SQL you are interested in, then you can expose that by including the EXECUTABLE_ID in the result set from MON_GET_TABLE_USAGE_LIST (or MON_GET_INDEX_USAGE_LIST) and then running this query
SELECT STMT_TEXT FROM TABLE (MON_GET_PKG_CACHE_STMT(NULL, executable ID, NULL, -2))
If I were now to re-run my query and then interrogate the table usage list again, I’d get this

What we can see here is
- The last updated time (column 2) has changed from 13:16:48 to 13:39:13, which matches the time I submitted my query
- The References value has incremented by 1 to a total of 2. We can infer that the recorded figures are therefore going to have been updated by our second execution of the query, and we can check that by extracting the EXECUTABLE_ID and querying MON_GET_PKG_CACHE_STMT
- The rows read has increased to 10,000,000. I’m not putting much faith in this; I think it’s just going to go up by the total row count of the table every time
- Logical reads are now 3,842. That’s double the figure from last time, so it’s still retrieved 1,921 pages of data from the Bufferpool.
- Physical reads have not increased; it’s still 50. So, the query was satisfied entirely with data stored in memory.
- The synopsis table too has retrieved the same number of pages from memory and made no physical disk access
So, this is giving us some insight into what is occurring as far as the columnar table access goes. And there are a lot more elements available; you could look into overflow accesses, lock waits and escalations, etc., etc. But I’m still interested in what those CPMA indexes are up to and I can’t do that with usage lists.
For that, I’m going to need to start using the MON_GET_TABLE and MON_GET_INDEX table functions (and a couple of others besides). We’ll take a look at those options in the next blog.