

In the first blog in this series ( Finding the access path for Columnar queries ) I was griping about not being able to see any detail in the explain plans for what DB2 is doing when you see a table scan (TBSCAN) of a column-organized table. I mention that each columnar table will have a synopsis table to enable row skipping, and each of these tables (including the synopsis) will have a CPMA (Columnar Page Map) index, but that you can’t easily see how, or indeed if, these structures are being used. In the next blog ( Finding the access path for Columnar queries #2 ) I explored usage lists as one way of working out what is happening. The limitation on these is that they won’t handle those CPMA indexes. So, let’s try the MON table functions and see if they’ll do the job.
MON_GET_TABLE etc
I’m going to use both MON_GET_INDEX and MON_GET_TABLE, but lets start with the latter. In a similar fashion to the way I was exploiting USAGE LISTS, I need to store the before and after statistics in order to get a delta showing what happened when a particular columnar table was accessed.
What I have in my test scenario is 3 tables which need to be joined for my test queries:
- CONTRACT_TYPE a reference table with 3 rows
- CUSTOMER another reference table, but with 200+ rows
- CONTRACT a fact table with 5,000,000 rows of randomly generated data
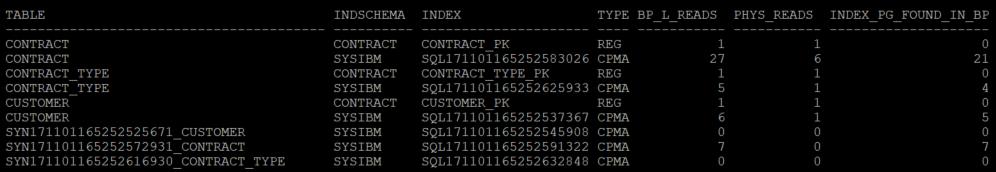
If I interrogate the system catalogues, this is what we have (click to enlarge)
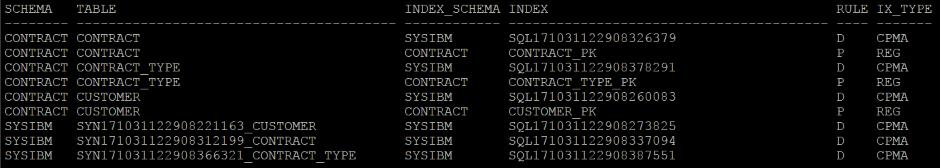
There are 2 rows of data for each of my defined tables; one for the generated CPMA index and one for manually created Primary Key, and then 1 row for each of the associated synopsis tables and their CPMA index.
Step 1
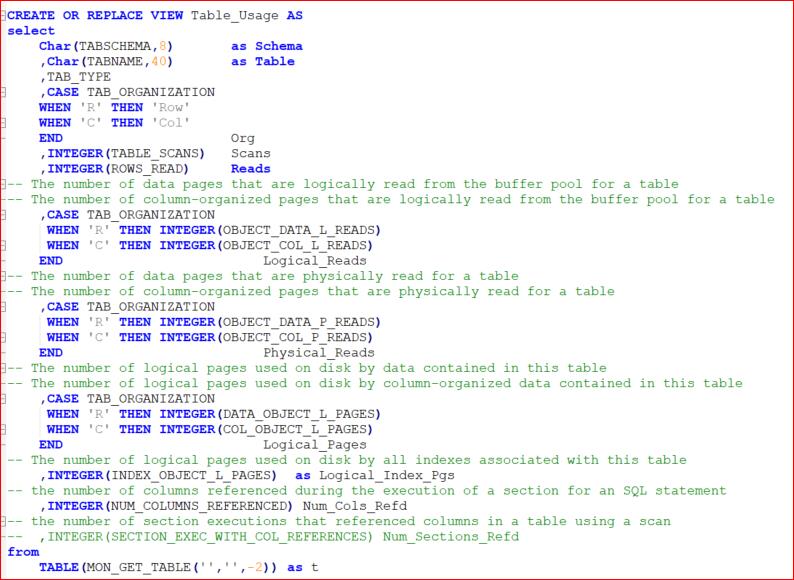
Create a view based on the MON_GET_TABLE table function. I’ve written the SQL below but there are 94 available metrics in this function (as of V11.1.2.2) so there are many more options available to you.
Gotcha #1
You’ll notice that I haven’t supplied a TabSchema as input to the table function; although I could limit the output by giving it the value of CONTRACT (which is the schema where my CONTRACT_TYPE, CUSTOMER and CONTRACT tables are), it would eliminate the synopsis tables which are under SYSIBM
Step 2
Create a table to store data from this view, to allow a before and after picture. I just use this
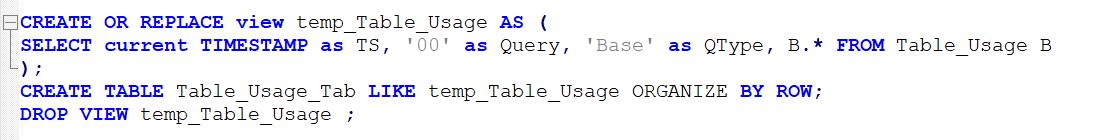
This allows me to store all the metrics from my TABLE_USAGE view and to label it with an execution timestamp, a value to identify which query I’m examining (in Query) and a value in QType to show when the query was run in relation to the metrics. I tend to use ‘Base’ to show the initial values and then ‘B4’ (before, geddit?) preceding the query I want to examine and the ‘FT’ after I’ve run it.
Step 3
Then when I execute my query I can precede it with something like this

And follow it with something like this

Step 4
You can do pretty much the same thing to get details from MON_GET_INDEX, MON_GET_PKG_CACHE_STMT and SYSIBMADM.MON_BP_UTILIZATION ( the MON_GET table functions are the more efficient mechanism but I’ve got a ‘legacy’ script based on the SYSIBMADM.MON_BP_UTILIZATION view mainly because it already has the Hit Ratios calculated, whereas with MON_GET_BUFFERPOOL you have to calculate them yourself).
Putting it into Practice
Let’s take one of my test queries, imaginatively called Q3. The SQL looks a bit messy but it’s intended to provoke some of the OLAP functionality that is what columnar data is all about.
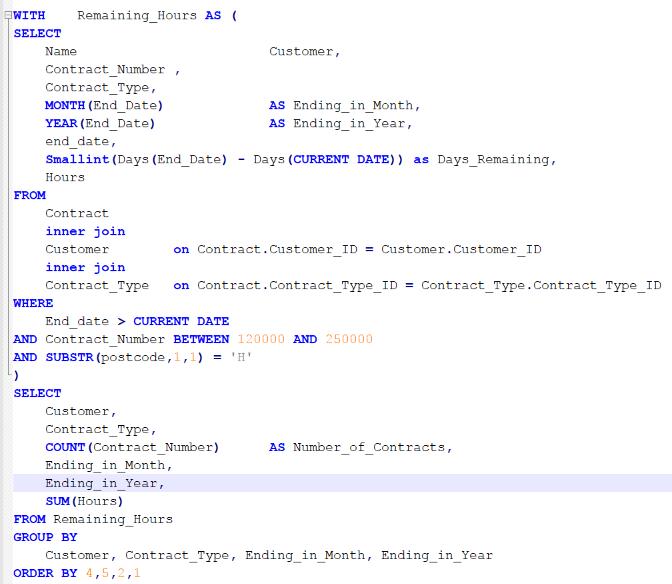
This is the access path for that query and, as you can see, it doesn’t give a lot away.
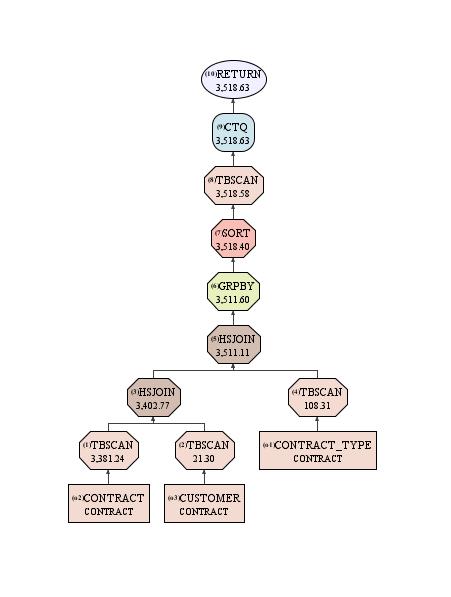
It looks pretty efficient but what if it stops being so? What, if after a period of running within perfectly acceptable parameters, the customer gets me out of bed one night and says “this crucial report is taking hours to run when it was only taking 20 seconds yesterday”? How do I find out what the TBSCAN of my 5 million row CONTRACT table actually involves?
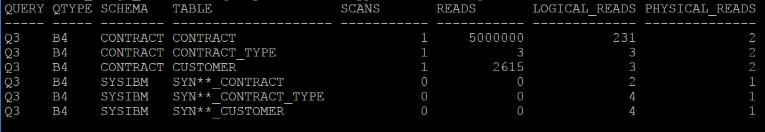
Let’s see if we can work out what it going on by using my before and after metrics. First off, the table metrics. Here is the picture from before my query
And this is after
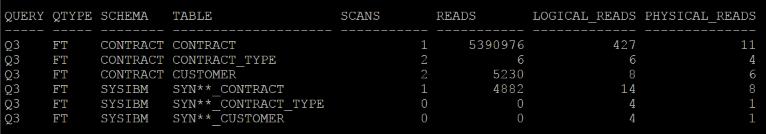
(for the sake of brevity, I’ve eliminated a lot of the columns available)
The first thing that strikes me is the use of the Synopsis tables. Or lack of. You can see that the SCANS value for CONTRACT_TYPE and CUSTOMER has gone from 1 to 2, and the READS value for the associated Synopsis tables are still 0. That suggests that both tables were scanned, end to end, with no data skipping happening (for a brief explanation of data skipping, see part #1 ). That might be a problem. In this example it’s not as the number of rows is so small that it is irrelevant.
The Logical Reads (number of column-organized pages that are logically read from the buffer pool) versus Physical Reads (number of column-organized pages that are physically read) is worth looking at. Ideally, we want it all be to logical, for both the source tables and the Synopsis tables; i.e. we want them to be resident in memory. But even the small tables have a number of physical reads. I would have hoped that they would be resident in memory as the “before” stats show that the entire table was read.
Let’s take a look at the index stats. As with the tables, here’s before and after:
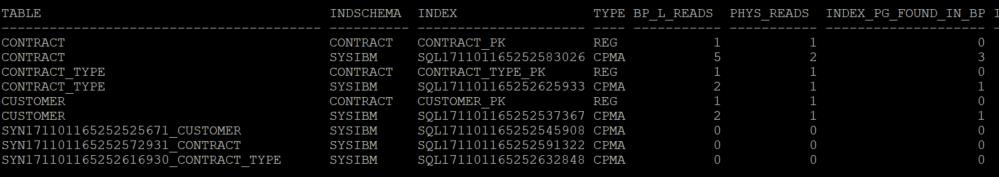
The positive news is that most of the index access is logical rather than physical. None of the ‘conventional’ Primary Key indexes have been used, but the CPMA indexes have been. For CONTRACT, there were 22 logical reads and 4 physical, for CONTRACT_TYPE 3 logical and 0 physical, and for CUSTOMER 4 logical and 0 physical.
This is confirmed by the figures for Index Pages found in Buffer Pool, which shows 18 for CONTRACT, 3 for CONTRACT_TYPE and 4 for CUSTOMER (the figure shown in Index_Pg_Found_in_BP is taken from OBJECT_INDEX_LBP_PAGES_FOUND and BP_L_Reads is taken from OBJECT_INDEX_L_READS, both retrieved from the MON_GET_INDEX table function. I won’t go into the differences here but have a look in the Knowledge Centre for those metrics and it’s pretty clearly explained).
Overall, this indicates that most index data is being retrieved from memory rather than incurring the additional I/O overhead of reading off disk.
Looking at the CPMA indexes associated with the Synopsis tables (which are the bottom 3 lines in each screenshot), there is still no activity for CONTRACT_TYPE or CUSTOMER but these are very low volume tables and this would suggest that the use of the synopsis tables is deemed unnecessary by the optimizer. It has, however, invoked 7 logical reads of the CPMA index for the CONTRACT synopsis table which is what we want to see: data skipping being achieved through the use of index details retained in memory. Ideal. If there was extensive physical activity in this row, or if there were no synopsis activity at all, I’d be more concerned.
In Summary
This process will allow you to infer what has happened in the execution of a query against a columnar table. And there is a lot more data in the functions that I haven’t referred to here, but this does mean that you need to capture a before and after snapshot in order to make sense of what the query has done. If you’re attempting to find out what has happened to a particular query; if it’s performance has dropped off a cliff, you’ll need to extract from your production (or whatever) environment, and then reproduce the problem so that you can get the before and after picture. Time-consuming and not altogether easy. But it’s better than just seeing TBSCAN and having to take that on faith. One day we’ll get Explain to show us the full picture but, in the meantime, this is probably our best option.